Associated template
Several types of document templates exist to allow the management of new use cases, such as appendices to the main templates.
Training prerequisites
- Have already done a configuration of a main template
- Update the package to the latest version
It is possible to add one or more documents after a main document was generated, thanks to the associated documents. These documents can be added with or without conditions. They are dependent on the main document and cannot be generated alone.
These documents can be added with or without conditions. They are dependent on the main document and cannot be generated alone.
For example, this may be General Terms and Conditions of Sale or Product Sheets.
Related document template
- First, you need to create and configure the main document template
- In the Doc tab of your main template, click New Associated Template
- Give the model a name and choose the type of associate you want to create:
Static : The document does not contain tags.
In this case, there is no choice of main object.
Example: static terms and conditions
Dynamic : The document contains tags.
In this case, the object is selected from among the primary or secondary type objects of the main document template.
Example: an appendix with dynamic information
Multiple : The document contains tags and is repeated according to the number of child objects in the main document.
In this case, the object is selected from among the child objects of the main document template.
Example: product sheets, the main document contains a table with 5 products, then the associated document will be added 5 times after the main document, once for each product
Chart : The document is an Excel file that contains a graph to be displayed on the document to be generated
For more details, you can consult The dedicated article
Once the associated document has been created, you will be redirected to the document template in order to load the desired template via the “Add a template” button.
It is also possible to link an existing associated document template to a main document template.
- On your main template, go to the Doc tab then click on Link an associated document template
- Choose an existing associated template then save

You can add conditions for displaying an associated document after the main document.
- On your main template, go to the Doc tab, then for the desired associated document template, click on the action arrow and then on Edit condition
- Build your display condition as desired
Example: You want the associated document to be added only if the status of the opportunity is “Proposal”

Graphic Associated Document Template
- Use the Grenoble 2.3 package version
- Have a document template and know how to manage Excel tables and documents with Gonexa
- Verify that the value of the “Graph” picklist is available
If it is not the case:
Go to Configuration > Object Manager > Document Template > Fields and Relationships.
Look for the Type field (gnx__type__c).
If the “Graph” value is missing, click New (values), name it “Graph”, then validate.
Go to the Record Types > Associate tab.
Edit the selection list available for the type field and change the “Graph” value from available to selected.
Save.
This associated template is a technical appendix for creating charts from Excel data and displaying them in a Word or PowerPoint document.
Creating the associated model
- From your main document template, go to the tab Doc And on the block Related models.
- If necessary, create child objects to generate graphs on linked objects (e.g. Contract + Contract Lines)
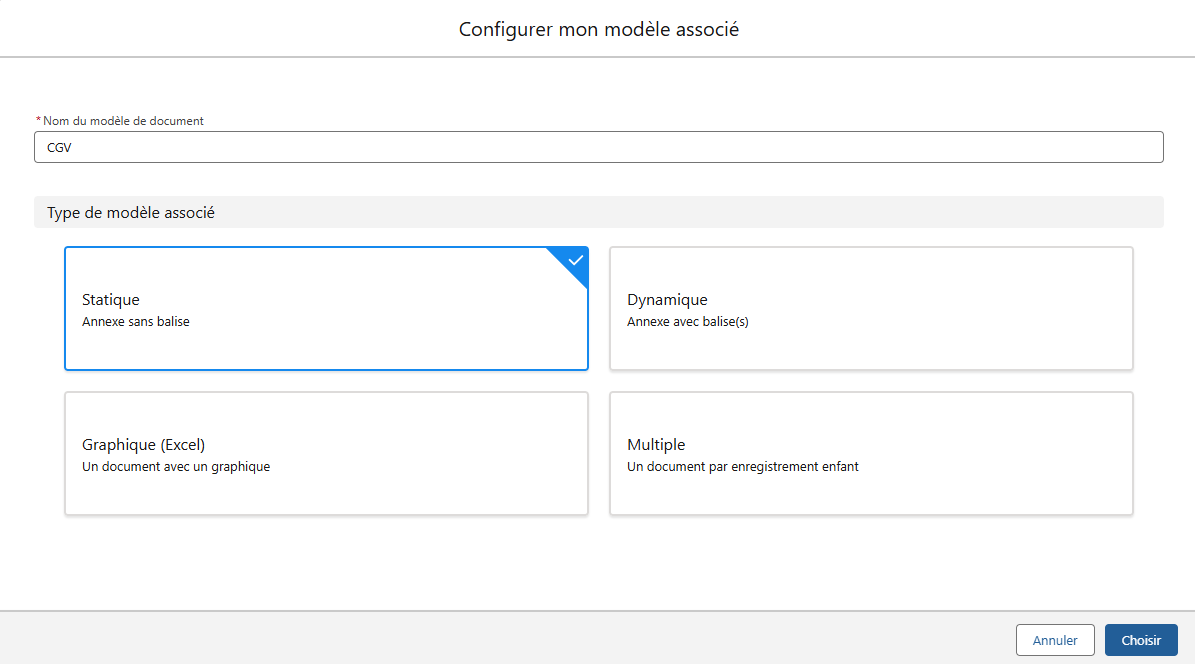
- Click on New associated template and name it (ex.: Charts)
- Select template type: Chart (Excel)
- The “Choice of the main model object” field will be filled in by default
- Click on Choose
Creating the Excel document
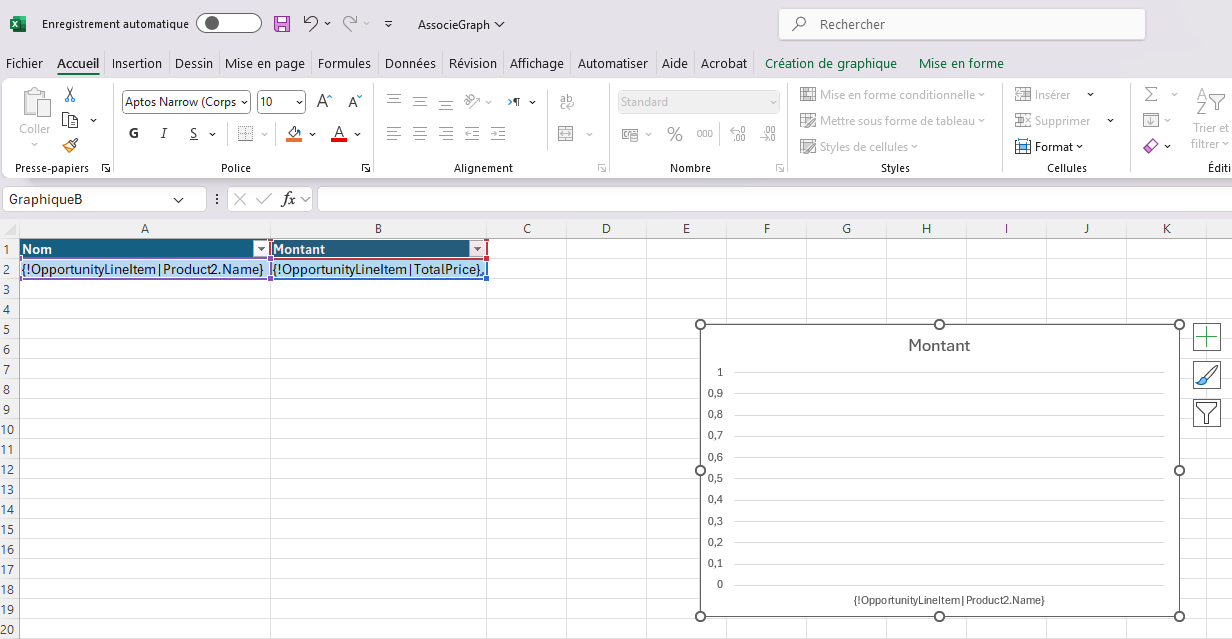
- Create an Excel file containing the necessary data tables (e.g. a table on contract lines)
- Make sure the table is properly defined as an Excel table (Insert tab > Table)
- Add the header and tags as in a classic child table
- Create the charts by selecting the table in question, then go to Insert tab > Chart
- Add a title and a legend to each chart
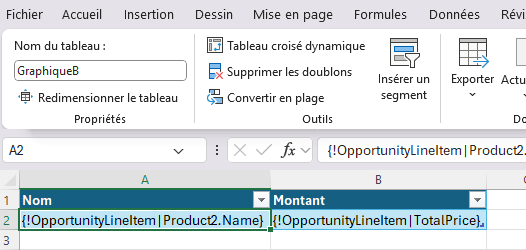
- Select the table and give the table a name in the “Table” tab same as the chart name (ex: GraphicB)
- Add a title and a legend to each chart
- Click on the graph and define in the “name box” a unique name for the chart (ex: GraphicB)
Inserting the chart into the main document
- From Salesforce, in the Main Templates block, access your main model
- Open the main document (Word or PowerPoint)
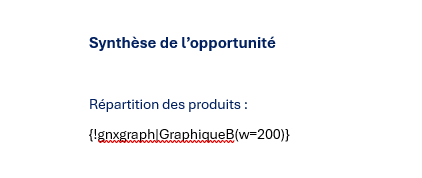
- Place the tag where you want to insert the chart
Tag syntax: {!gnxgraph|graph_name(w=200)}
GRAPH_NAME : corresponds to the exact name of the chart in Excel (ex.: ChartB).
w=200 : defines the width of the graph in pixels (ex: 150 for a reduced size)
Example: {!gnxgraph|ChartB(w=150)}
Table name = Chart name
Table + Chart on the same Excel sheet if you want to update the rows of the chart
In summary
Step 1: Salesforce Setup
Main model: do the configuration as if there were no graphics on the object model and other characteristics
Associated model: configure the object model correctly
Step 2: Build a table and define a name
Step 3: Base a chart on the same name
Step 4: Put the name in a tag in Word or PowerPoint & define the size